by
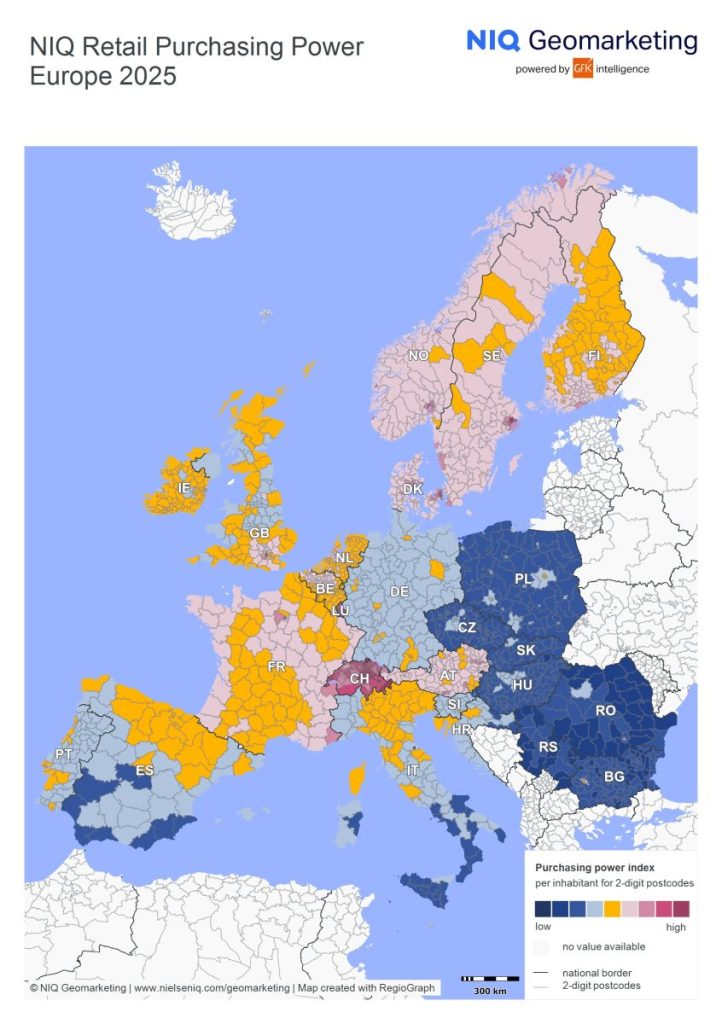
Across the 25 European countries analyzed, average retail purchasing power amounts to €6,714 per capita. In total, this represents a combined retail spending potential of more than €3.5 trillion. While these figures underline the overall strength of the European consumer market, a closer look reveals pronounced differences beneath the surface.

Clear Leaders at the Top
Luxembourg once again tops the European ranking. With €12,518 in retail purchasing power per capita, the country exceeds the European average by more than 86 percent. Switzerland follows in second place with €12,080 per capita, almost 80 percent above the European mean, while Denmark ranks third at €9,452 per capita.
Northern and Western European countries dominate the upper part of the ranking. Norway, Sweden, Austria, Finland, France, Belgium and the Netherlands all record clearly above-average values. Overall, 12 of the 25 countries included in the study show above-average per capita retail purchasing power, whereas 13 countries remain below the European average.
Retail Purchasing Power in Europe
| Ranking | Country | Inhabitants | Per capita retail purchasing power in euros | European retail purchasing power index* |
| 1 | Luxembourg | 681,973 | 12,518 | 186.4 |
| 2 | Switzerland | 8,962,258 | 12,080 | 179.9 |
| 3 | Denmark | 5,992,734 | 9,452 | 140.8 |
| 4 | Norway | 5,594,340 | 9,085 | 135.3 |
| 5 | Sweden | 10,587,710 | 9,004 | 134.1 |
| 6 | Austria | 9,158,750 | 8,712 | 129.8 |
| 7 | Finland | 5,635,971 | 8,555 | 127.4 |
| 8 | France | 66,351,959 | 8,386 | 124.9 |
| 9 | Belgium | 11,825,551 | 7,897 | 117.6 |
| 10 | Netherlands | 18,044,027 | 7,769 | 115.7 |
| 11 | Ireland | 5,351,681 | 7,449 | 111.0 |
| 12 | United Kingdom | 69,281,437 | 7,086 | 105.5 |
| Europe-25 | 521,864,300 | 6,714 | 100.0 | |
| 13 | Portugal | 10,749,635 | 6,528 | 97.2 |
| 14 | Croatia | 3,861,967 | 6,242 | 93.0 |
| 15 | Germany | 84,669,326 | 6,226 | 92.7 |
| 16 | Spain | 48,619,695 | 6,181 | 92.1 |
| 17 | Italy | 58,934,177 | 6,157 | 91.7 |
| 18 | Slovenia | 2,130,850 | 6,013 | 89.6 |
| 19 | Poland | 37,489,087 | 4,939 | 73.6 |
| 20 | Czech Republic | 10,909,500 | 4,868 | 72.5 |
| 21 | Hungary | 9,539,502 | 4,834 | 72.0 |
| 22 | Slovakia | 5,419,451 | 4,720 | 70.3 |
| 23 | Bulgaria | 6,437,360 | 4,448 | 66.2 |
| 24 | Romania | 19,067,576 | 3,880 | 57.8 |
| 25 | Serbia | 6,567,783 | 3,849 | 57.3 |
© NIQ Retail Purchasing Power Europe 2025 * Index per inhabitant: European average = 100
Large Consumer Markets Below the Average
Several of Europe’s largest retail markets fall slightly below the continental average in per capita terms. Germany (€6,226), Spain (€6,181) and Italy (€6,157) all sit just under the European benchmark, despite their substantial total market volumes.
Portugal, with €6,528 per capita, comes closest to the European average and marks the midpoint of the ranking. At the lower end, the table is dominated by Eastern and Southeastern Europe. Serbia, with €3,849 per capita, records the lowest retail purchasing power, equivalent to just over 57 percent of the European average, followed by Romania and Bulgaria.
How Much Income Flows into Retail
A closer look at the share of retail purchasing power within total purchasing power offers additional insights into consumer spending structures across Europe. In lower-income markets such as Bulgaria, Serbia and Croatia, retail accounts for close to half of total purchasing power, reflecting the high proportion of household budgets devoted to everyday goods.
By contrast, high-income countries show a significantly lower retail share. In Germany, retail purchasing power accounts for just over 21 percent of total purchasing power, the lowest value among all countries analyzed. Switzerland and the United Kingdom also record comparatively low retail shares, pointing to more diversified household spending patterns.
Regional Disparities Matter Most
Beyond national averages, retail purchasing power in Europe is largely shaped at the regional level. Capital cities and major metropolitan areas consistently outperform their national averages, often by a wide margin. London, Paris, Vienna, Stockholm and Copenhagen stand out as prime examples, concentrating a disproportionate share of retail spending potential within their respective countries.
At the same time, the data shows that even high-income countries are far from regionally homogeneous. Small markets such as Luxembourg and Switzerland display particularly strong internal differences, while larger countries such as Germany, Italy and Spain combine leading urban regions with structurally weaker peripheral areas. In parts of Eastern and Southeastern Europe, retail purchasing power is even more strongly concentrated in single metropolitan regions, leaving large rural areas well below the European average. For retailers and investors alike, these findings underline a clear message: regional dynamics matter.

Want to see country-specific maps and data?
Download the free compendium to get the full picture.
Originally published in ACROSS Magazine Issue 2/2026

Explore the complete edition and download your complimentary digital copy now.