Filip Vojtech—an expert in retail as well as fashion & lifestyle for GfK’s Geomarketing solution area—talks about GfK Visitor Frequencies and how this data provides valuable insights for location evaluations.
How has COVID-19 impacted German retail and are there regional differences?
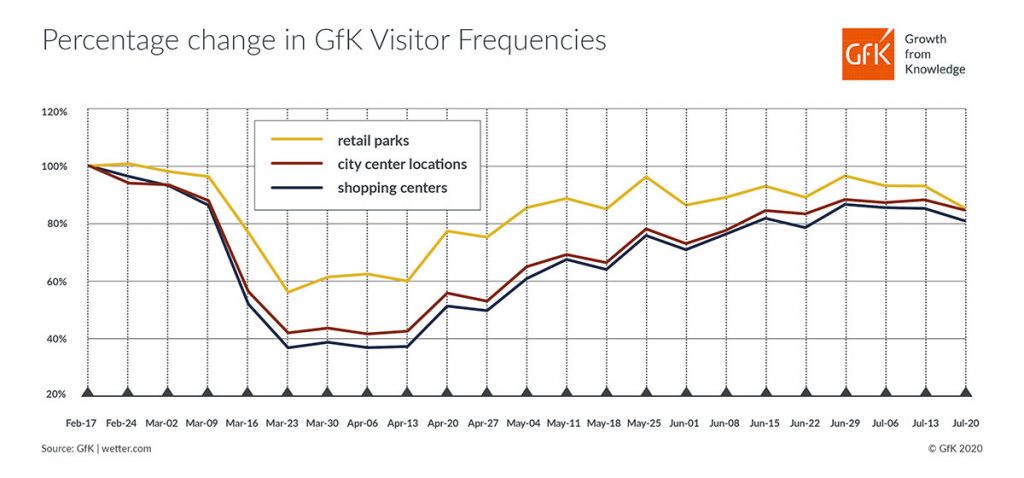
Evaluating the trajectory of the visitation numbers from before the spread of COVID-19 until now, it’s clear that visitor numbers already began declining around the end of February amidst increasing media coverage on the virus. With the onset of the lockdown, visitor numbers to all of Germany’s retail locations plummeted precipitously, with the low point occurring in the second week of the lockdown (March 23-29). Due to the increased restrictions during this period, visitor numbers fell to around 40 percent compared to the period prior to COVID-19. An assessment of regional trends is very interesting along these lines: While visitation frequency during the aforementioned week declined the most in Berlin, the surrounding federal state of Brandenburg was Germany’s least impacted region in this regard. Reviewing the entire time period in question, the federal state of Mecklenburg-Western Pomerania fared best, while Berlin was Germany’s most affected area.
It’s also important to note that not all retail locations were impacted equally. Retail parks provided essential services during the lockdown through their grocery retailers and drugstores. They consequently experienced the lowest decline in visitor numbers compared to the other retail formats. Much harder hit by COVID-19 were the fashion-oriented city centers and shopping centers, which experienced complete closures in some cases.
How well has Germany’s retail scene recovered since the end of the lockdown?
Our data shows a nationwide increase and largely ongoing recovery in visitor numbers following the end of the lockdown and the reopening of shops on April 20. For example, Mecklenburg-Western Pomerania has now achieved and even exceeded the pre-COVID-19 visitation numbers. Among Germany’s retail locations, shopping centers continue to lag the furthest behind, while retail parks are recovering the most quickly. While visitation numbers for all retail types are on the whole approaching the pre-COVID-19 level, they have not yet reached that point. There are three factors to consider along these lines: First, consumers continue to be wary of shopping due to the fear of infection. Second, they have less motivation to linger and browse as a result of the mask requirement and its impact on the shopping experience. And third, visitation numbers are typically higher in the summer compared to the colder weeks that preceded the lockdown. In order to evaluate the latter factor more precisely, we will soon be comparing these numbers with those of the previous year.
Yet another insight has emerged from our analyses: Shopping locations in cities with more than 500,000 residents are suffering the most from the decline in visitor numbers, while retail sites in mid-sized and especially smaller metropolises are recovering significantly more successfully. A possible explanation is the ongoing high number of employees working in home office situations. These consumers are more likely to shop near their places of residence rather than combining their commute to and from the office with shopping excursions to city center destinations in large cities.
What are the applications of GfK Visitor Frequencies for companies?
This data adds value in numerous ways, because it offers insights not only into visitor frequencies for specific locations, but also into where visitors were previously, where they go after shopping, where they live and work, and how long they lingered at a particular location, among other factors. These anonymized and aggregated geospatial insights are very valuable for a wide range of applications, such as planning and optimizing location networks. The data can also be used for coordinating region-sensitive media campaigns and optimizing category management strategies. Companies with chains can additionally use the data to evaluate the competition. For example, the data makes it possible to determine visitation trends with respect to competitor locations, the geographic origin of consumers shopping at these sites, and the number of people who shop at both competitor and one’s own locations.
GfK already offers a broad spectrum of market data for evaluating locations. What’s makes GfK Visitor Frequencies unique?
Our visitor frequency data is available at a very granular level and is compiled on a continual basis, which distinguishes this product from many other types of geodata. For example, we track visits to retail locations on a daily basis and can consequently observe changes at a level approaching truly live or on-demand data.
Also, even deeper insights are possible by combining the visitor frequency data with our other GfK geodata. For example, we can analyze not just the visitation frequency for a specific shopping center, but also where these consumers live. This is all done in a completely anonymous way that protects privacy and cannot be used to identify individuals. We can also combine the data on specific shopping centers or points of sale with our wide-ranging demographic data and information on shopping behavior, to name two possibilities. For each analyzed shopping center, we are therefore able to determine the number of visitors as well as a detailed profile of these consumers. We can even provide insights on visitors’ spending potential for specific product groups in euros.
How can this data on visitor frequency be used to identify market gaps and evaluate prospective locations?
In this case, we generally work with benchmarks. Initially, we evaluate with our clients the visitor numbers at existing locations for which we also have turnover figures. This allows us to determine the visitor frequency levels that are likely to lead to successful outcomes for our clients’ prospective locations. When possible, we bring in additional location criteria, such as the prevalence of relevant target groups in the areas of interest. The synergy of these data insights allows us to offer prognoses for specific locations as well as for broader market regions, enabling our clients to identify white spots or coverage gaps. Clients can then use these results to make more informed location decisions.